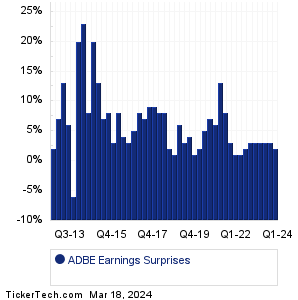
| ADBE Earnings Surprises | ||||||||||||||||||||||||||||||||||||||||||||||||||||||||||||||||||||||||||||||||||||||||||||||||||||||||||||||||||||||||||||||||||||||||||||||||||||||||||||||||||||||||||||||||||||||||
|
|
|
| ADBE Earnings Surprises | ||||||||||||||||||||||||||||||||||||||||||||||||||||||||||||||||||||||||||||||||||||||||||||||||||||||||||||||||||||||||||||||||||||||||||||||||||||||||||||||||||||||||||||||||||||||||
|
|
|
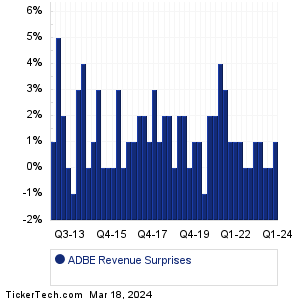
| ADBE Revenue Surprises | ||||||||||||||||||||||||||||||||||||||||||||||||||||||||||||||||||||||||||||||||||||||||||||||||||||||||||||||||||||||||||||||||||||||||||||||||||||||||||||||||||||||||||||||||||||||||
|
| ADBE Current Stock Quote |
Get Dividend Alerts Get SEC Filing Alerts |
| ADBE Stock Price Chart |
| Next Earnings Dates |
Next Earnings Date Calendar:Coda Octopus Group (CODA): 3/18/2024 6:00 AMAcurx Pharmaceuticals (ACXP): 3/18/2024 7:01 AM Science Applications Intl (SAIC): 3/18/2024 7:05 AM System1 (SST): 3/18/2024 8:00 AM Exagen (XGN): 3/18/2024 8:00 AM Comtech Telecom (CMTL): 3/18/2024 After close Alpine Immune Sciences (ALPN): 3/18/2024 After close Lantern Pharma (LTRN): 3/18/2024 After close Singular Genomics Sys (OMIC): 3/18/2024 After close National CineMedia (NCMI): 3/18/2024 After close More from the Next Earnings Dates Calendar Earnings History:Legacy Housing (LEGH): 3/15/2024 5:28 PMLument Finance Trust (LFT): 3/15/2024 After close NI Holdings (NODK): 3/15/2024 After close Consumer Pf Servs (CPSS): 3/15/2024 2:00 PM Tredegar (TG): 3/15/2024 8:15 AM Telos (TLS): 3/15/2024 8:03 AM ProPhase Labs (PRPH): 3/15/2024 8:00 AM Jabil (JBL): 3/15/2024 7:45 AM Paltalk (PALT): 3/15/2024 7:30 AM Groupon (GRPN): 3/15/2024 7:09 AM More from the Earnings History archive |
| Earnings Peers |
| Adobe (ADBE) is categorized under the Technology sector; to help you further research past earnings across stocks, below are some other companies in the same sector:
ADEA Historical Earnings ADI Historical Earnings ADSK Historical Earnings ADTN Historical Earnings AEHR Historical Earnings AEIS Historical Earnings AEVA Historical Earnings AEY Historical Earnings AEYE Historical Earnings AGFY Historical Earnings |
Click the button below for your complimentary copy of Your Early Retirement Portfolio: Dividends Up to 9.5%—Every Month—Forever.
You'll discover the details on 4 stocks and funds that pay you massive dividends as high as 9.5%.