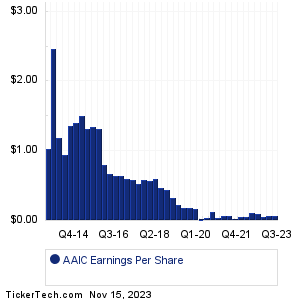
| AAIC Earnings History | ||||||||||||||||||||||||||||||||||||||||||||||||||||||||||||||||||||||||||||||||||||||||||||||||||||||||||||||||||||||||||||||
|
|
|
| AAIC Earnings History | ||||||||||||||||||||||||||||||||||||||||||||||||||||||||||||||||||||||||||||||||||||||||||||||||||||||||||||||||||||||||||||||
|
|
|
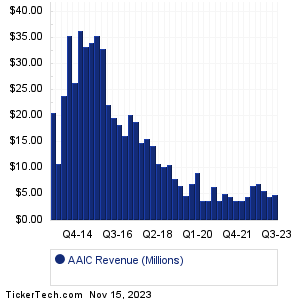
| AAIC Revenue History | ||||||||||||||||||||||||||||||||||||||||||||||||||||||||||||||||||||||||||||||||||||||||||||||||||||||||||||||||||||||||||||||
|
| AAIC Current Stock Quote |
Get Dividend Alerts Get SEC Filing Alerts |
| AAIC Stock Price Chart |
| Next Earnings Dates |
Next Earnings Date Calendar:Fortune Brands (FBIN): 11/15/2023 2:10 AMCrown Crafts (CRWS): 11/15/2023 6:00 AM Target (TGT): 11/15/2023 6:30 AM Advance Auto Parts (AAP): 11/15/2023 6:30 AM AIM ImmunoTech (AIM): 11/15/2023 6:30 AM Catalent (CTLT): 11/15/2023 7:00 AM Milestone Scientific (MLSS): 11/15/2023 7:00 AM BurgerFi International (BFI): 11/15/2023 7:00 AM Bio-Path Holdings (BPTH): 11/15/2023 7:00 AM TJX Companies (TJX): 11/15/2023 7:30 AM More from the Next Earnings Dates Calendar Earnings History:Momentus (MNTS): 11/14/2023 5:43 PMPAVmed (PAVM): 11/14/2023 5:00 PM Precision Optics Corp (POCI): 11/14/2023 After close Presidio Property Trust (SQFT): 11/14/2023 After close Cineverse (CNVS): 11/14/2023 After close Sadot Group (SDOT): 11/14/2023 After close FlexShopper (FPAY): 11/14/2023 After close Fluent (FLNT): 11/14/2023 After close Flexible Solutions Intl (FSI): 11/14/2023 After close Canoo (GOEV): 11/14/2023 After close More from the Earnings History archive |
| Featured Articles |
| Earnings Peers |
| Arlington Asset Inv (AAIC) is categorized under the Financials sector; to help you further research past earnings across stocks, below are some other companies in the same sector:
AAME Past Earnings AAT Past Earnings ABCB Past Earnings ABR Past Earnings ABTX Past Earnings AC Past Earnings ACBI Past Earnings ACC Past Earnings ACGL Past Earnings ACIC Past Earnings |
Recommended: Top Ten Hedge Funds Holding PLRG, MVV YTD Return, GCO YTD Return.
Click the button below for your complimentary copy of Your Early Retirement Portfolio: Dividends Up to 9.5%—Every Month—Forever.
You'll discover the details on 4 stocks and funds that pay you massive dividends as high as 9.5%.