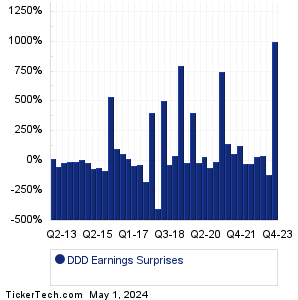
| 3D Sys Earnings Surprises | ||||||||||||||||||||||||||||||||||||||||||||||||||||||||||||||||||||||||||||||||||||||||||||||||||||||||||||||||||||||||||||||||||||||||||||||||||||||||
|
|
|
| 3D Sys Earnings Surprises | ||||||||||||||||||||||||||||||||||||||||||||||||||||||||||||||||||||||||||||||||||||||||||||||||||||||||||||||||||||||||||||||||||||||||||||||||||||||||
|
|
|
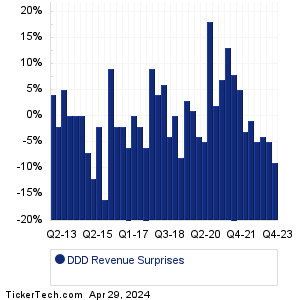
| DDD Revenue Surprises | ||||||||||||||||||||||||||||||||||||||||||||||||||||||||||||||||||||||||||||||||||||||||||||||||||||||||||||||||||||||||||||||||||||||||||||||||||||||||
|
| DDD Current Stock Quote |
Get Dividend Alerts Get SEC Filing Alerts |
| DDD Stock Price Chart |
| Next Earnings Dates |
Next Earnings Date Calendar:AirSculpt Technologies (AIRS): 8/11/2023 6:00 AMMammoth Energy Services (TUSK): 8/11/2023 6:00 AM American Strategic (NYC): 8/11/2023 6:00 AM Spectrum Brands Holdings (SPB): 8/11/2023 6:30 AM Star Equity Hldgs (STRR): 8/11/2023 6:30 AM Advent Technologies Hldgs (ADN): 8/11/2023 7:00 AM Moleculin Biotech (MBRX): 8/11/2023 7:05 AM The Real Good Food (RGF): 8/11/2023 7:30 AM Vislink Technologies (VISL): 8/11/2023 7:30 AM Biofrontera (BFRI): 8/11/2023 7:30 AM More from the Next Earnings Dates Calendar Earnings History:Epsilon Energy (EPSN): 8/10/2023 10:11 PMPredictive Oncology (POAI): 8/10/2023 5:15 PM cbdMD (YCBD): 8/10/2023 5:11 PM Servotronics (SVT): 8/10/2023 After close Nuvve Holding (NVVE): 8/10/2023 After close Xcel Brands (XELB): 8/10/2023 After close Team (TISI): 8/10/2023 After close Geospace Technologies (GEOS): 8/10/2023 After close Biote (BTMD): 8/10/2023 After close Tonix Pharmaceuticals (TNXP): 8/10/2023 After close More from the Earnings History archive |
| Earnings Peers |
| 3D Sys (DDD) is categorized under the Technology sector; to help you further research past earnings across stocks, below are some other companies in the same sector:
DDOG Historical Earnings DELL Historical Earnings DGII Historical Earnings DGLY Historical Earnings DH Historical Earnings DHX Historical Earnings DIOD Historical Earnings DLB Historical Earnings DMRC Historical Earnings DOCN Historical Earnings |
Recommended: Lincoln National shares outstanding history, Funds Holding RE, FLWS Videos.
Click the button below for your complimentary copy of Your Early Retirement Portfolio: Dividends Up to 7.8%—Every Month—Forever.
You'll discover the details on 4 stocks and funds that pay you massive dividends as high as 7.8%.